When the supply chain is measured in tons and minutes, knowing how much material you have and how it’s changing drives profit and safety. Modern LiDAR brings fast, non-contact measurement of volume, weight (via bulk density), and particle size distribution (PSD) to farms, quarries, mines, and bulk terminals. Below is a practical guide to how it works, where it fits, and how to deploy it with confidence.
3D accuracy at line speed: High point density enables millimeter or centimeter surface models of stockpiles, truck beds, silage bunkers, grain bins, hoppers, and conveyors.
Non-contact & lighting-agnostic: Works in darkness and varying light; multi-echo returns help in dust or chaff.
Real-time analytics at the edge: Pair sensors with embedded CPUs/GPUs to compute volumes, rates, and PSD on-site.
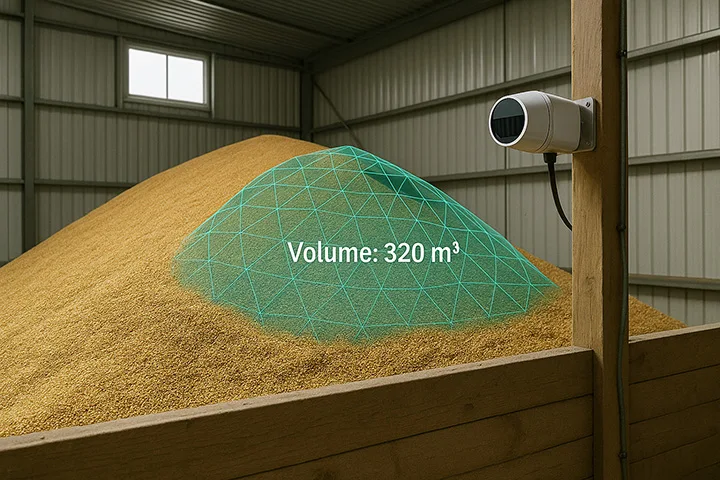
Create a 3D surface (mesh) from the point cloud and compute volume relative to a reference plane or baseline mesh (empty-bin model).
Stockpiles / Bunkers: Mesh-to-plane or mesh-to-mesh comparison.
Bins / Silos: Use a CAD baseline of the vessel; LiDAR scans provide infill height and surface shape.
Trucks / Railcars: Scan loaded profile versus known tare geometry for fast load checks.
Formula (conceptual):
V ≈ ∑ (signed tetrahedra between surface mesh and reference)
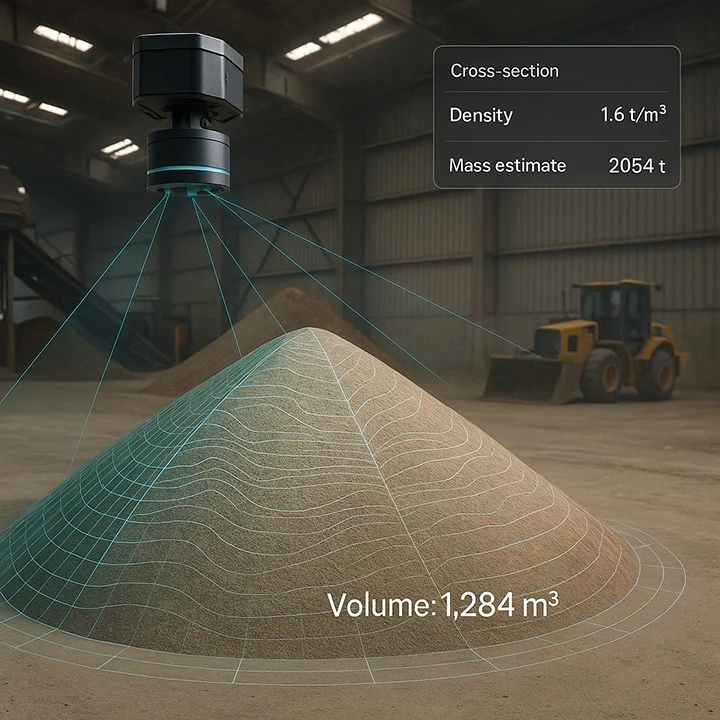
Convert volume to mass using bulk density:
Mass (t) = V (m³) × ρ_bulk (t/m³)
Adjust 𝝆bulk for moisture, compaction, and particle size.
Improve accuracy by periodically calibrating against belt scales, truck scales, or weighbridges.
For PSD on conveyors or in chutes:
Acquire dense scans over the belt section.
Pre-process (denoise, ground/belt removal, normal estimation).
Segment individual particles (region growing/watershed on the depth map or 3D-connected components).
Fit per-particle size metrics (Feret diameters, equivalent circle/volume).
Aggregate to percent-passing curve; report D10/D50/D90 or D32 (Sauter mean).
In particle size distribution, D10 is the particle size value below which 10% of the particles in a sample are found. It’s a percentile that helps define the fine end of the particle size range, indicating the quantity of ultrafine particles present in a powder or sample. The D10 value is typically measured in micrometers (μm).
What D10 represents:
The fine particle threshold: It marks the size of the smallest particles in the distribution.
A percentile: Along with D50 (the median size) and D90 (the size below which 90% of particles fall), D10 provides a comprehensive overview of the particle size distribution.
A measure of consistency: When considered with other percentiles, D10 helps to understnd the spread or consistency of the particle sizes in a sample.
Why it’s important:
Product quality:
Knowing the D10 value can be crucial for industries like pharmaceuticals, where it can affect drug effectiveness.
Industrial processes:
Particle size directly relates to industrial process performance, energy consumption, and product quality.
Correct for occlusions and edge bias; use multi-frame fusion to “see around” overlaps.
Validate periodically with sieve analyses to maintain traceability.
Continuous fill-level and volume.
Silage & feed bunkers: Pile volume tracking for ratio planning and shrink loss auditing.
Harvest logistics: Truck/load volume verification at the field edge; reduce under/overloads.
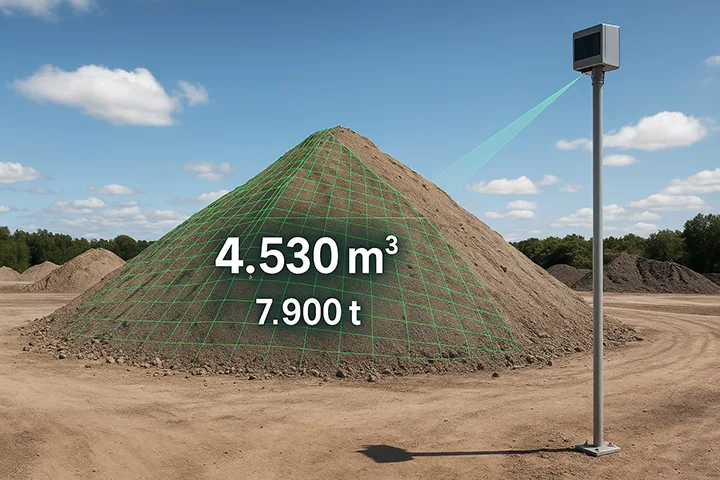
Frequent, safe 3D scans without walking the pile; monthly to hourly cadence.
Blast optimization feedback: Conveyor PSD after crushing/screening to tune blast and crusher settings.
Haulage verification: Rapid volumetric checks reduce overfill fines and optimize cycle times.
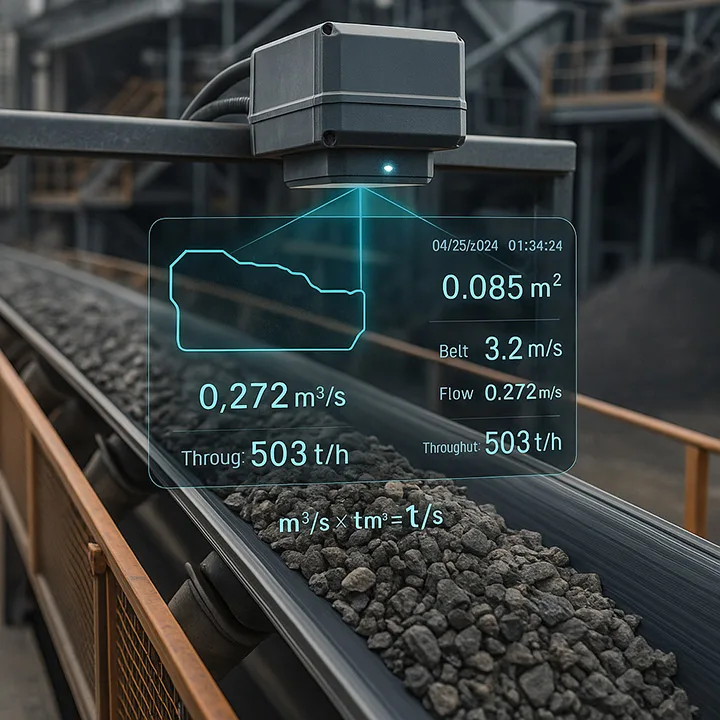
Cross-sectional area from LiDAR × belt speed × bulk density ⇒ tonnage rate.
Hopper/chute monitoring: Detect hang-ups, rat-holing, or asymmetric discharge.
Barge/railcar loading: Live 3D load profiles for even distribution and draft targets.
Overhead for conveyors and bins; mast or catwalk positions for piles.
Minimize occlusions; ensure safe mounting outside moving machinery envelopes.
Choose wavelength/optics for range and dust (905 nm vs 1550 nm; consider protective windows and air purge).
Range: Short (≤20 m) for conveyors; mid (20–80 m) for bins; long (80–300 m) for large piles.
Angular resolution / scan rate: Higher density for PSD; moderate density for volume-only.
FOV: Ensure complete coverage of belt width or pile footprint.
Ruggedness: IP65/67+, shock/vibration ratings, heating for cold starts.
Embedded CPU/GPU for on-site meshing, segmentation, and analytics.
I/O & Protocols: OPC-UA, Modbus/TCP, EtherNet/IP, REST/MQTT for SCADA/MES/EMS integration.
Volume, mass, tonnage rate
PSD curve (tables + plots)
Alarms (overfill, underfill, blockage)
Audit trail with timestamps, operator, and configuration hash.
Establish golden runs against scales and sieve stacks.
Track bulk density vs. moisture; maintain a density lookup by material and condition.
Schedule routine sensor health checks (window cleaning, laser power/temperature logs).
We can deliver LiDAR + embedded compute bundles preloaded with volume, mass, and PSD analytics—plus industrial I/O for drop-in integration.