

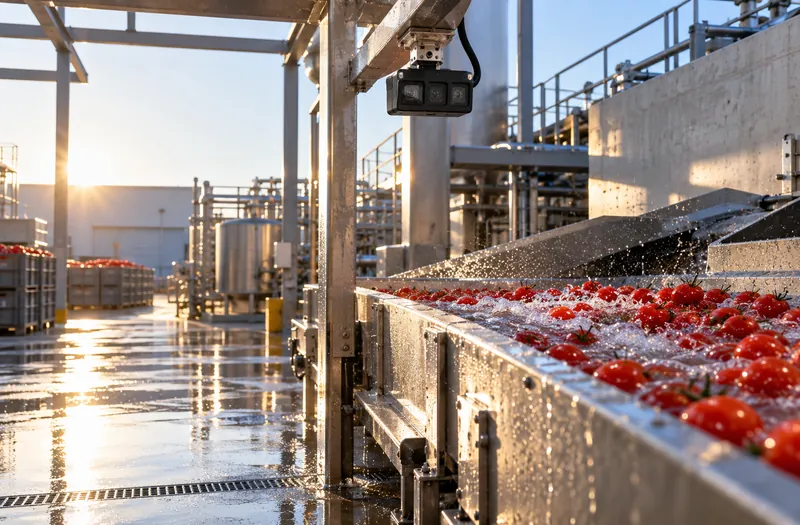
Liquids and solids together
Product floats in wash water, tumbles in flumes and arrives wet on the belt. Reflections, splash and foam confuse simple sensors and 2D cameras.
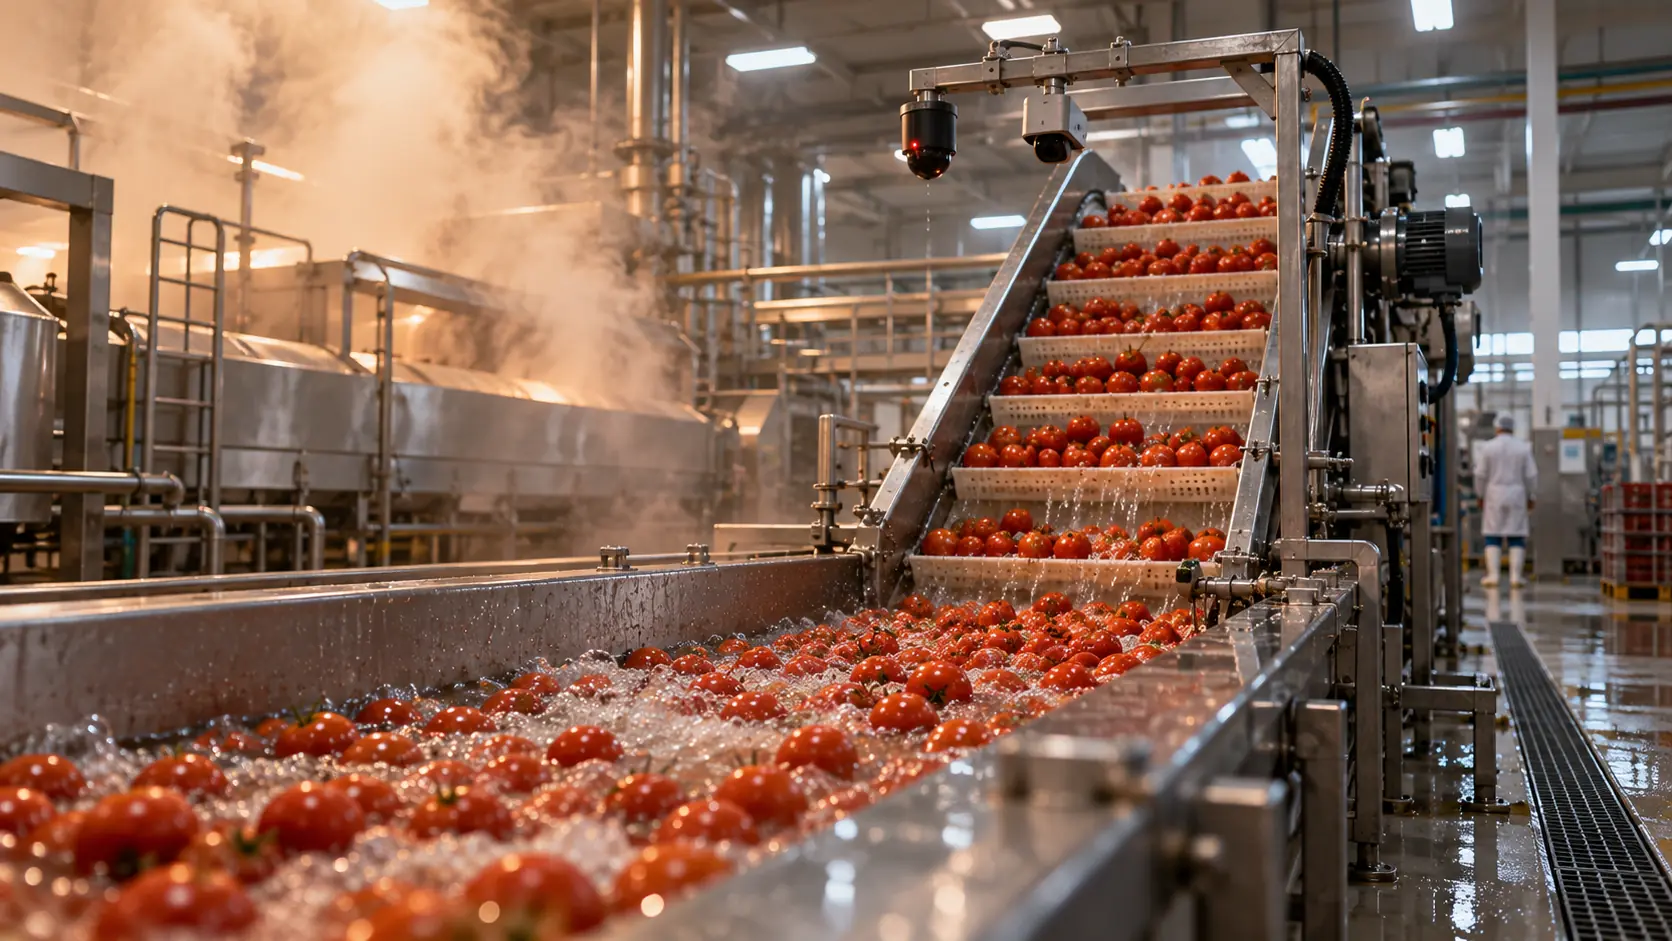
Where water, vapor and product meet, count what actually passes.
CRATUS monitors food processing lines with LiDAR and AI vision: item counts, volume, flow and fill levels on belts, flumes, wash tanks, hoppers and kettles. The system is built for the hard cases, where liquids and solids meet, lighting is poor or changing, and the air is full of dust or vapor, and sends results to your line controls and dashboards.
The challenge
Production lines are wet, bright, steamy and fast. The conditions that make food safe to produce make it hard to count.
Product floats in wash water, tumbles in flumes and arrives wet on the belt. Reflections, splash and foam confuse simple sensors and 2D cameras.
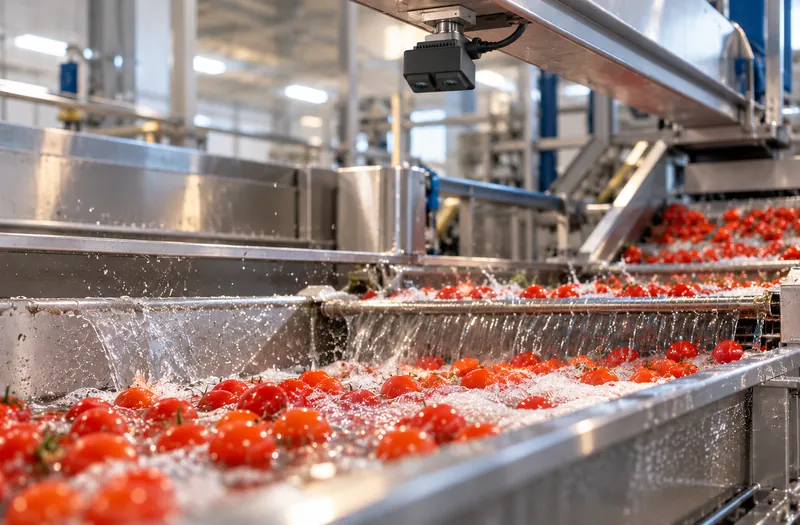
Glare on stainless steel and wet product, shadows, mixed lighting and lines that run outdoors change what a camera sees through the day.
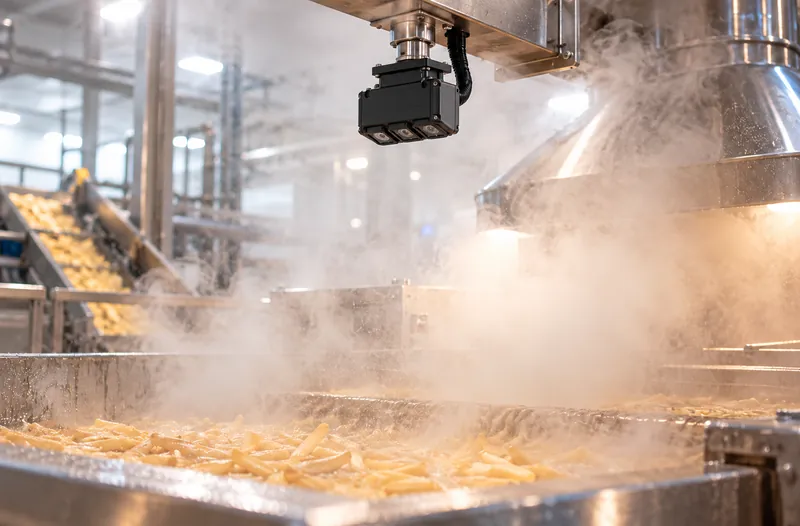
Blanchers, cookers and fryers fill the air with vapor; flour, sugar and spices fill it with dust. Lenses fog and foul, and readings drift.
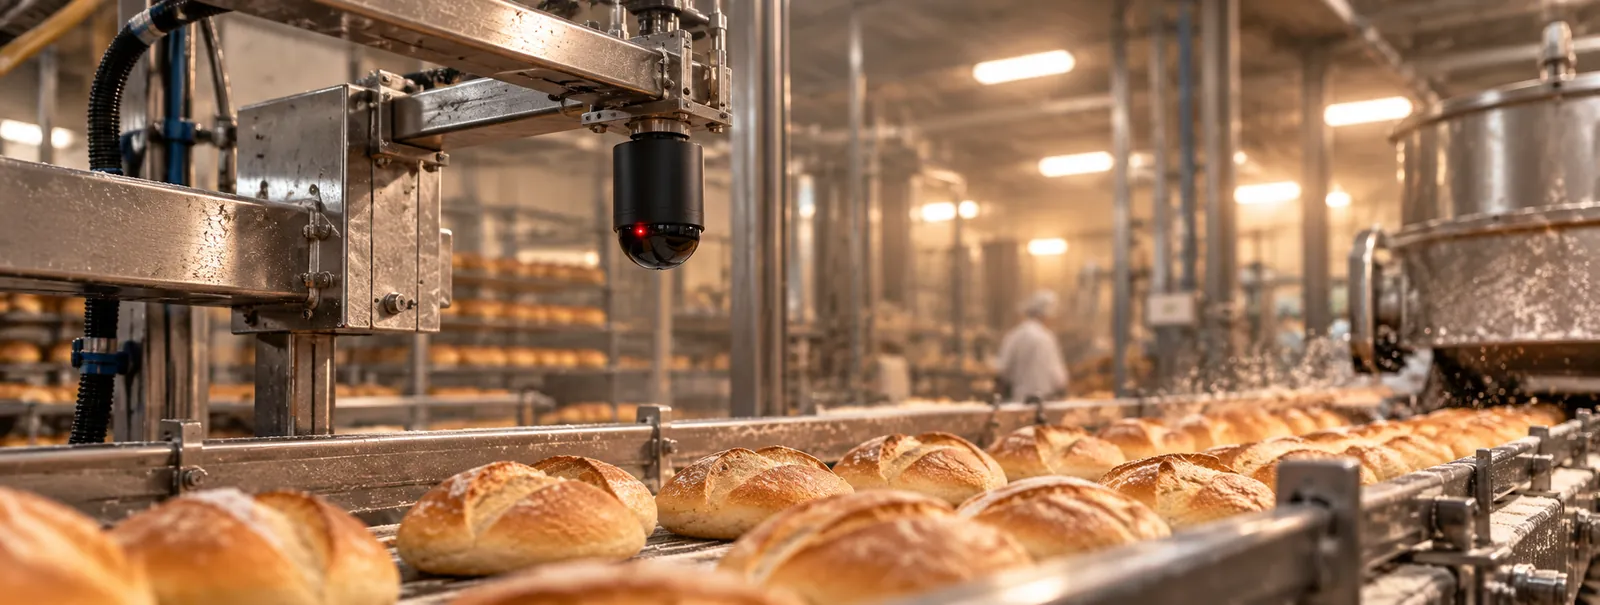
CRATUS combines LiDAR and AI vision, placed and protected for wet, steamy and dusty lines.
See the approachDifficult conditions
Every line is different. These are the conditions we plan for.
| Condition | What goes wrong | How CRATUS handles it |
|---|---|---|
| Product in water | Reflections, splash and floating product | LiDAR and AI vision trained to separate product from water and foam |
| Glare and wet surfaces | Bright spots and missing areas in images | LiDAR unaffected by visible glare; controlled lighting for vision |
| Low or changing light | Counts drift with time of day | LiDAR brings its own light |
| Steam and vapor | Fogged lenses, scattered readings | Placement out of the plume, purge air and filtering |
| Dust (flour, sugar, spices) | Fouled windows, falling accuracy | Purge collars, sealed enclosures and cleaning schedules |
| Wash-down | Water and chemicals on equipment | Sealed, washable enclosures rated for wash-down where required |
| Touching and stacked product | Items merge in 2D | 3D separation with LiDAR plus AI vision |
Sensor selection, placement and protection are set per line during the survey.
What we measure
Counts, amounts and levels across food and beverage processing.
Our approach
LiDAR, AI vision, edge computing and software, engineered as one system by one team.
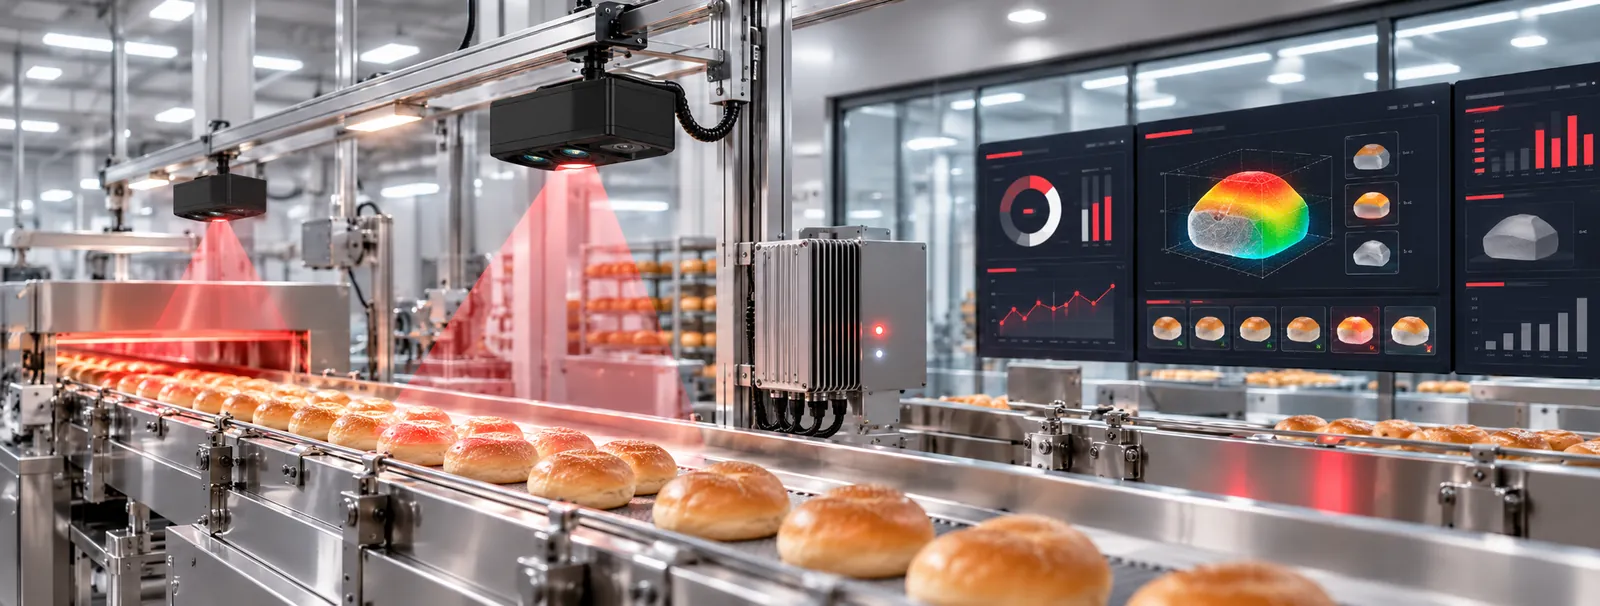
Sensing
LiDAR measures shape, height and volume in 3D regardless of light and color. AI vision cameras add appearance: size, color and surface. Each is placed and protected for the conditions on your line.
Edge computing
An edge computer at the site merges every sensor into one live picture and computes the analytics locally, so results, not raw sensor streams, leave the site over Ethernet, Wi-Fi or cellular.
Software & integration
Counts, rates, volume and levels per line and per shift on a dashboard, sent to your PLC, SCADA or MES over MODBUS, OPC UA or MQTT, with alerts for jams, gaps and low supply.
AI
AI separates product from water, foam and the belt, splits touching items, and screens size and appearance, trained on your product and your line.
What we deliver
One line or a whole plant.
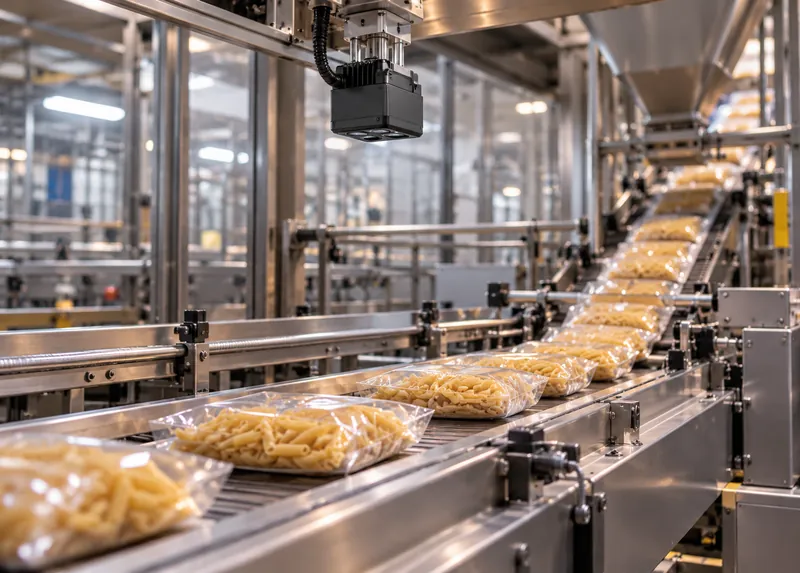
Produce, portions, pieces and packs counted on belts, chutes and in flumes.
Sensing · AI
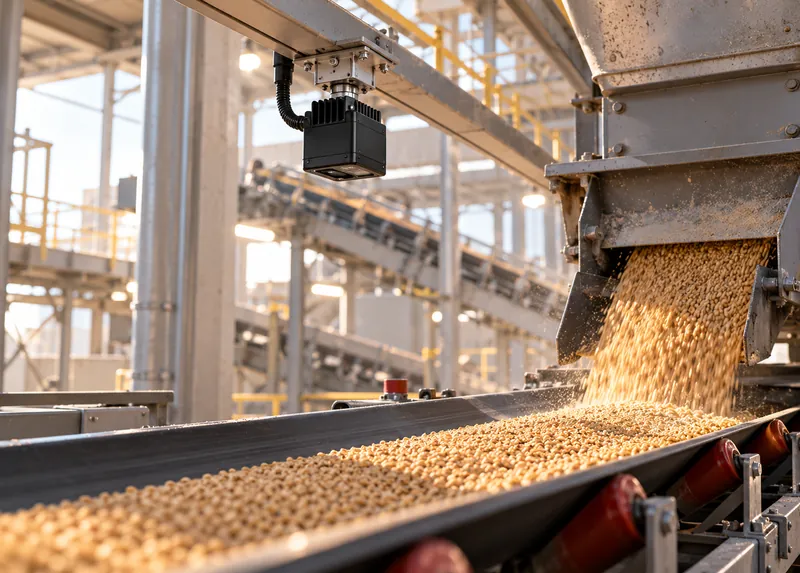
Volume and flow rate of bulk product such as fries, chips, nuts and grains.
Sensing · Edge
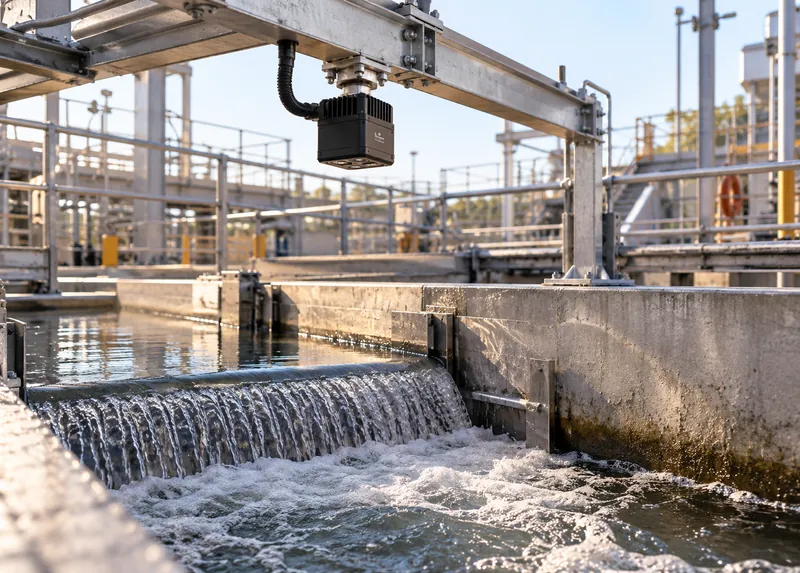
Product load in water, overflow and feed rate into the next step.
Sensing · AI
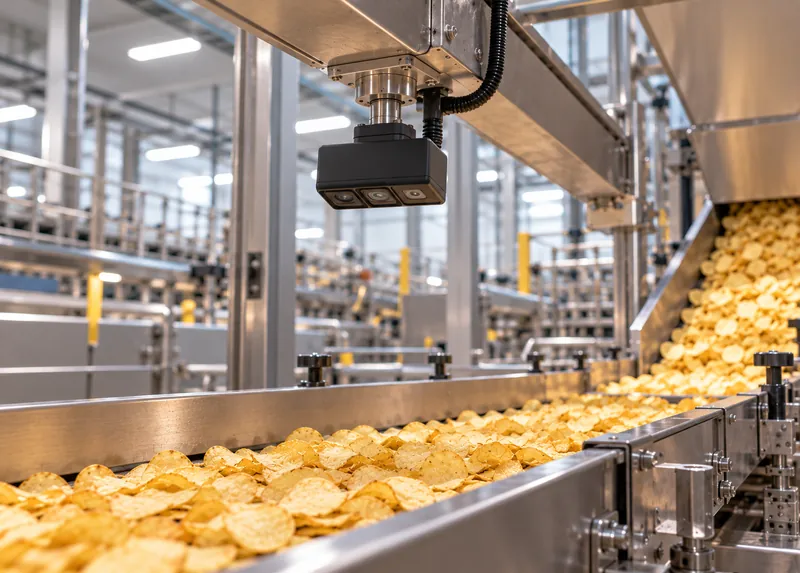
Fill levels of solids and liquids, so supply never runs out unnoticed.
Sensing
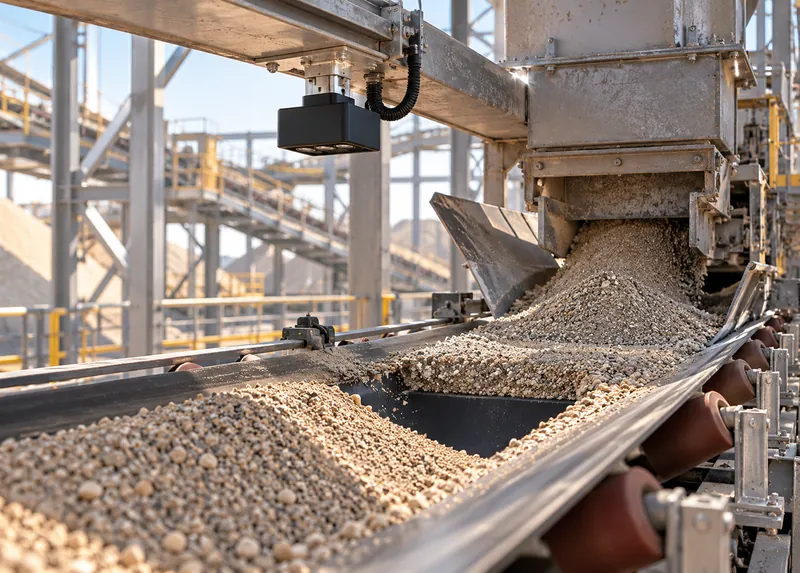
Empty belt sections, pile-ups at transfers and uneven spread across the belt.
Software · AI
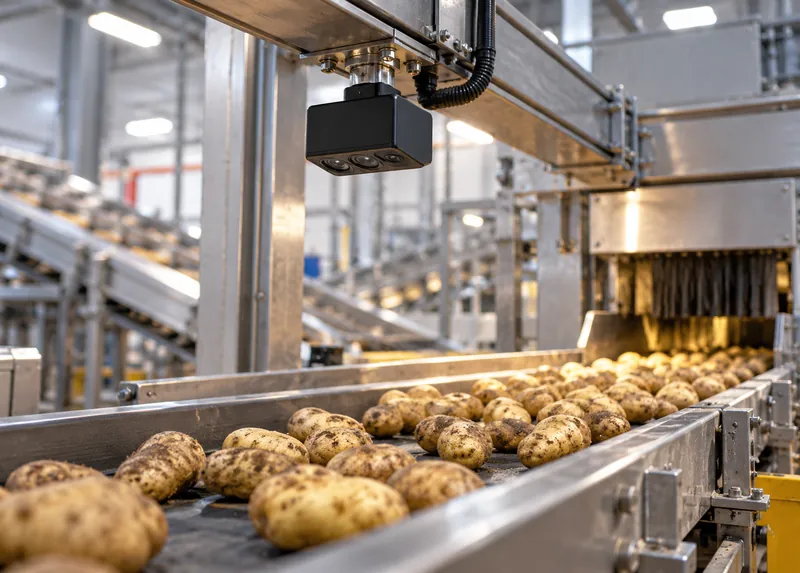
Size distribution and appearance checks with AI vision.
AI
The CRATUS line monitoring system
Sensor types, placement and protection are chosen per line.
Shape, height and volume
Measures what is on the belt or in the tank in 3D, regardless of light and color.
Appearance
Adds what LiDAR cannot see: color, surface and appearance.
ASSET-Rx EDGE
Fuses LiDAR and vision and runs the AI models at the line.
For wet and dusty lines
Keeps sensors clean and sealed where water, vapor and dust are present.
Per line and shift
Line data for production, quality and maintenance teams.
PLC, SCADA, MES
Sends results into the controls and systems already running the plant.
One system
CRATUS surveys the line, selects and protects the sensors, trains the AI on your product and integrates results with your controls.
All CRATUS productsThese details let CRATUS plan monitoring for your line.
How we work
Every line is surveyed for its conditions, and the AI is trained on your product before results go live.
Product, measurement needed, line layout, speed and conditions.
Sensor selection and placement; sample data collected from your line.
AI trained on your product; sensors installed with enclosures and purge where needed.
Counts and volumes checked against manual counts or weighed batches.
Live line data, alerts and integration, with retraining as products change.
Standards & practices
Equipment over a food line has to meet hygiene, safety and security expectations.
Certification is issued by accredited third parties. CRATUS designs and documents installations to these references and supports your food safety plan; we don’t self-certify.
Counts, amounts and levels: items on belts and in flumes, volume and flow of bulk product, fill levels in hoppers, bins, tanks and kettles, and gaps, jams and spacing on conveyors.
Each covers the other’s weak spot. LiDAR measures shape and volume in 3D regardless of light; AI vision sees color and surface. Together they count and measure where either alone would struggle.
Yes. LiDAR and AI vision are trained to separate product from water, splash and foam, so product in flumes and wash tanks can be counted and its load estimated.
No, with the right placement. Sensors are positioned out of the plume where possible, protected with purge air, and readings are filtered for vapor.
Dusty lines use purge collars, sealed enclosures and a cleaning schedule so sensor windows stay clear.
Yes, where required. Sensors are installed in sealed enclosures rated for wash-down and mounted with stainless hardware.
Yes. Counts, rates, volumes and levels can be sent over MODBUS, OPC UA or MQTT to your PLC, SCADA or MES.
Against your own references. At commissioning, counts and volumes are compared with manual counts or weighed batches, and the AI is retrained as products change.
Send us the site layout, what you need to measure and how the space is used. A CRATUS engineer replies with questions, a sensor layout and a phased plan.
Yes. CRATUS works directly with operations teams, system integrators and IT departments, and provides network requirements, installation instructions and remote support during commissioning.
Talk to a CRATUS engineer
Send us photos or a short video of the line and what you need to measure. A CRATUS engineer will reply with a sensor plan.
Keep exploring
GET IN TOUCH
One of our experts will be communicating with you shortly. We are committed to understanding your application and providing support, tailored to your specific requirements.