

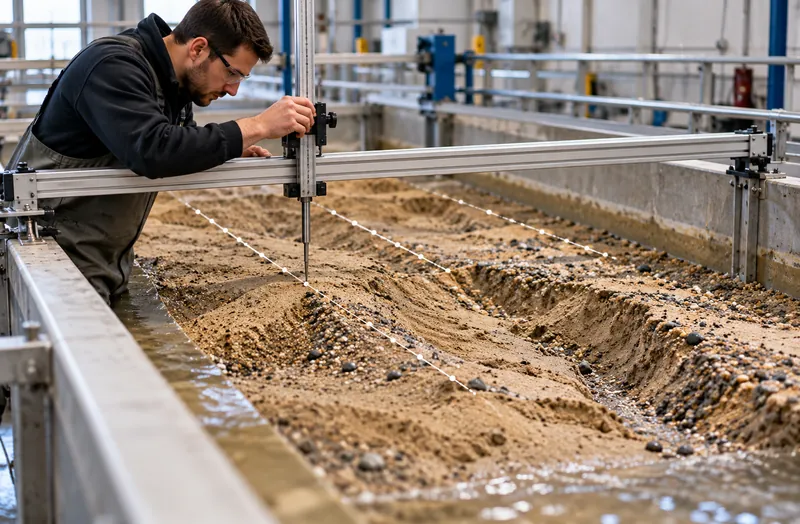
Manual profiling is slow
Point gauges and profilers measure lines, not surfaces. Covering a model bed takes hours, and the detail between lines is lost.
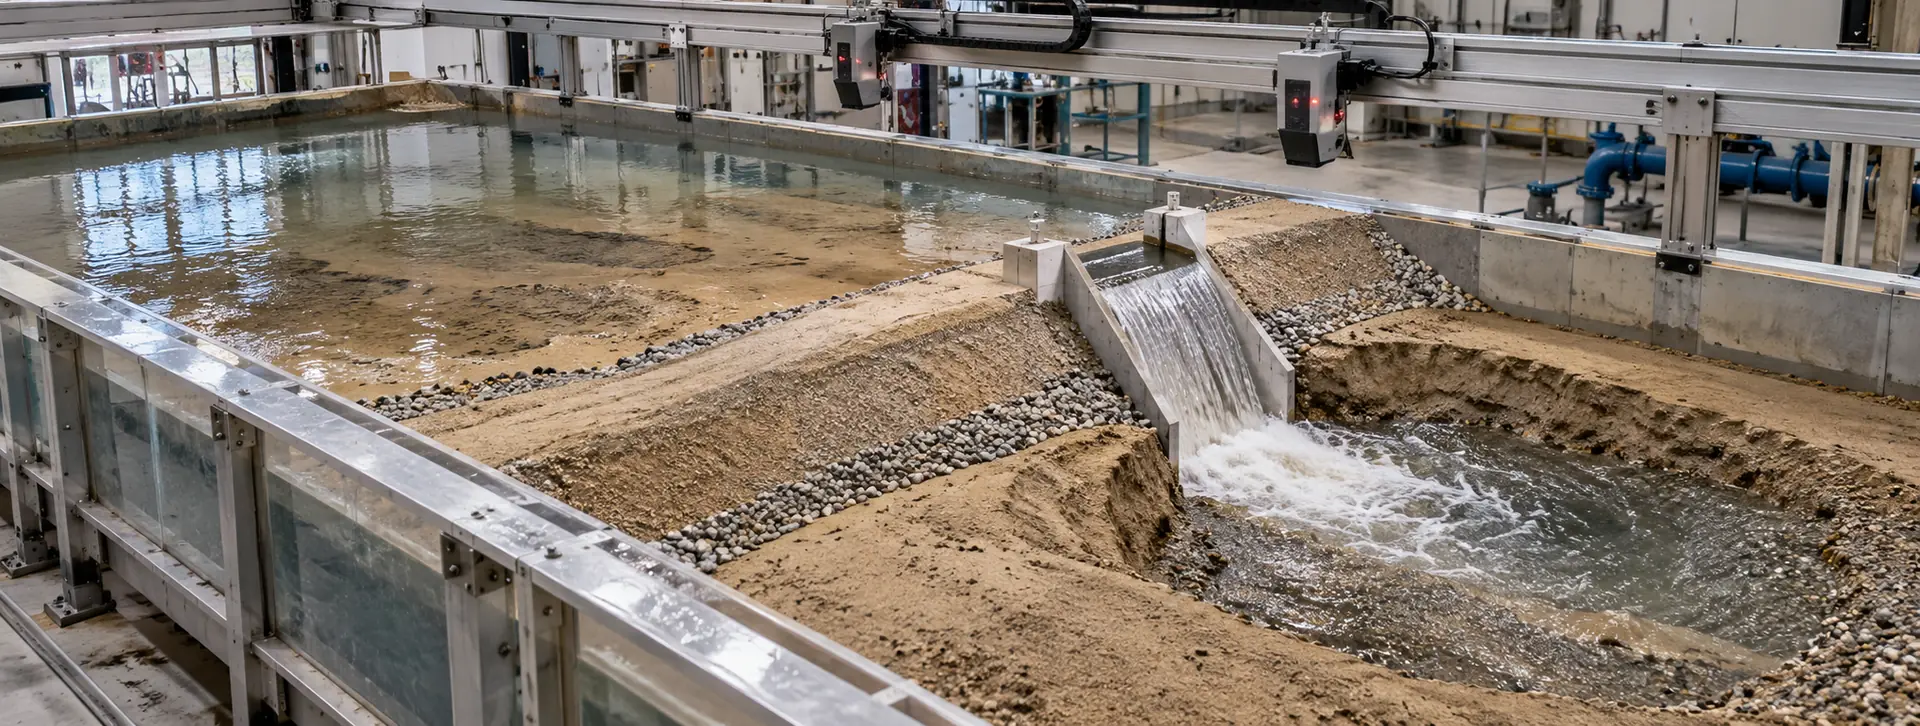
Where the earth went, and how much of it.
CRATUS applies its LiDAR volume measurement technology to indoor dam and hydraulic models: fixed LiDAR sensors scan the model bed before, between and after runs, and the software compares surfaces to map where earth eroded and where it accumulated, with volumes per zone. Hydraulic laboratories and research teams get repeatable erosion and deposition data without manual profiling.
The challenge
Physical dam models show how earth moves under flow. Turning that into numbers is where most of the effort goes.
Point gauges and profilers measure lines, not surfaces. Covering a model bed takes hours, and the detail between lines is lost.
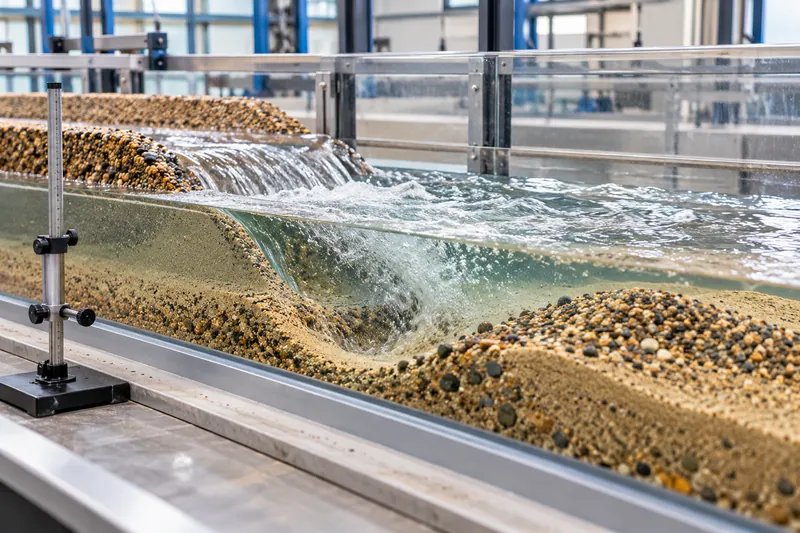
Scour holes and deposits evolve during a run. A single post-run survey misses how the pattern developed.
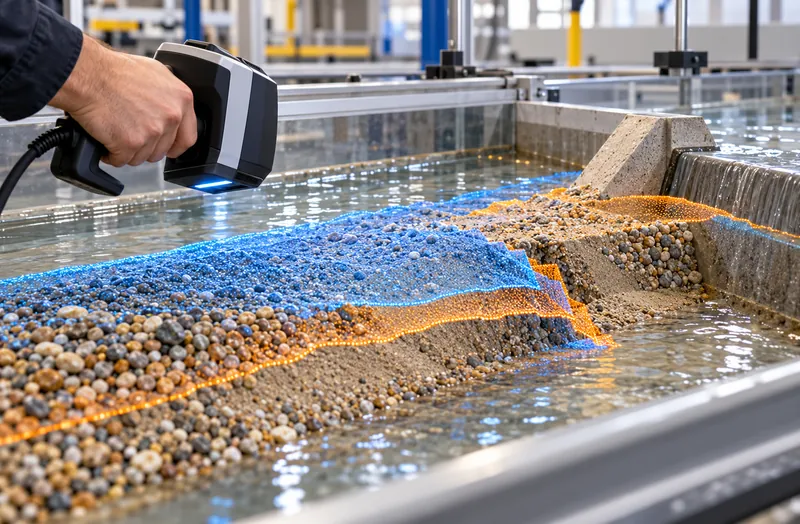
Handheld or moved scanners need registration for every scan. Small alignment errors look like erosion.
Fixed LiDAR sensors scan the same bed from the same positions, so every run is directly comparable.
See the approachModel areas
Zones are set on your model grid and reported separately.
Our approach
CRATUS VMS combines LiDAR sensing, edge computing, software and AI, engineered as one system by one team.
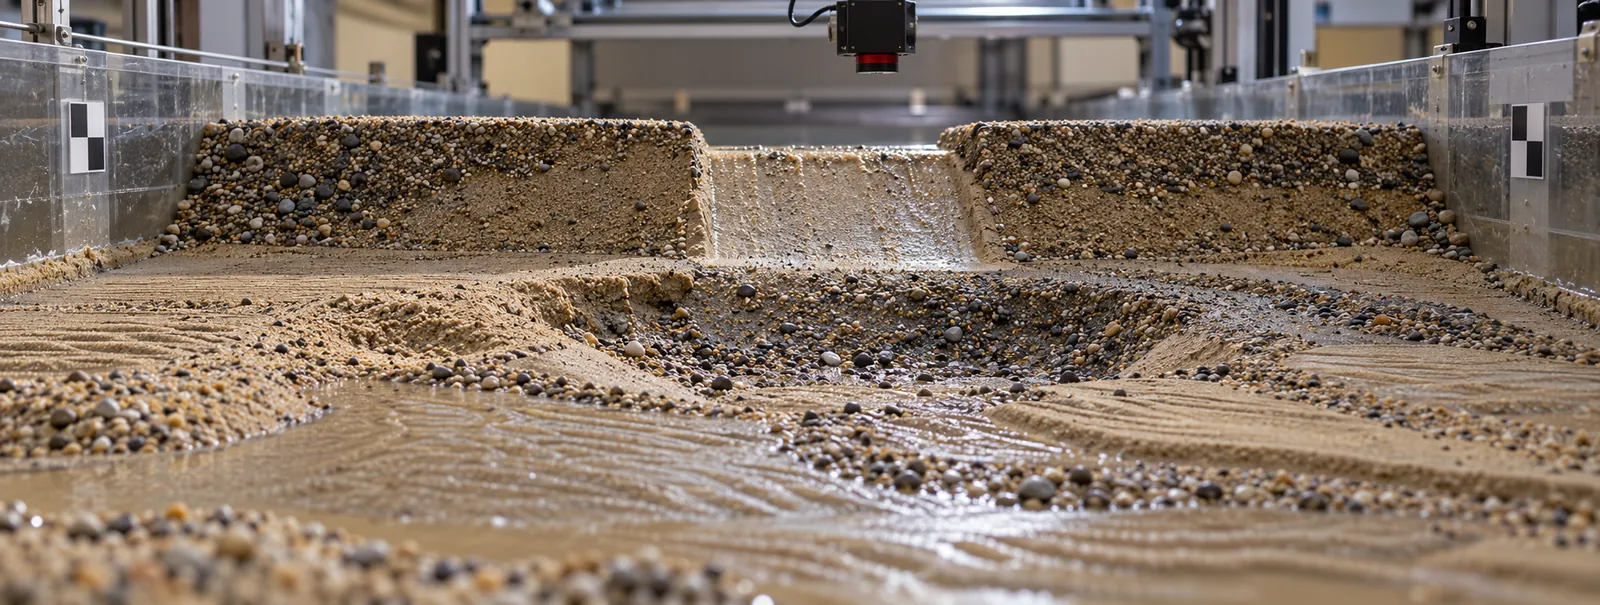
LiDAR sensing
Fixed LiDAR sensors mounted above the material measure its surface as a dense 3D point cloud, with their own laser light, so darkness, glare and uniform color do not matter. We combine wide field-of-view LiDARs for overall coverage with directional LiDARs where a corner, crater or far wall needs a closer look.
Edge computing
An edge computer at the site merges every sensor into one surface, computes volume per zone and sends results, not raw video, over Ethernet, Wi-Fi or cellular. Sites without easy IT access can start on cellular.
Software & dashboards
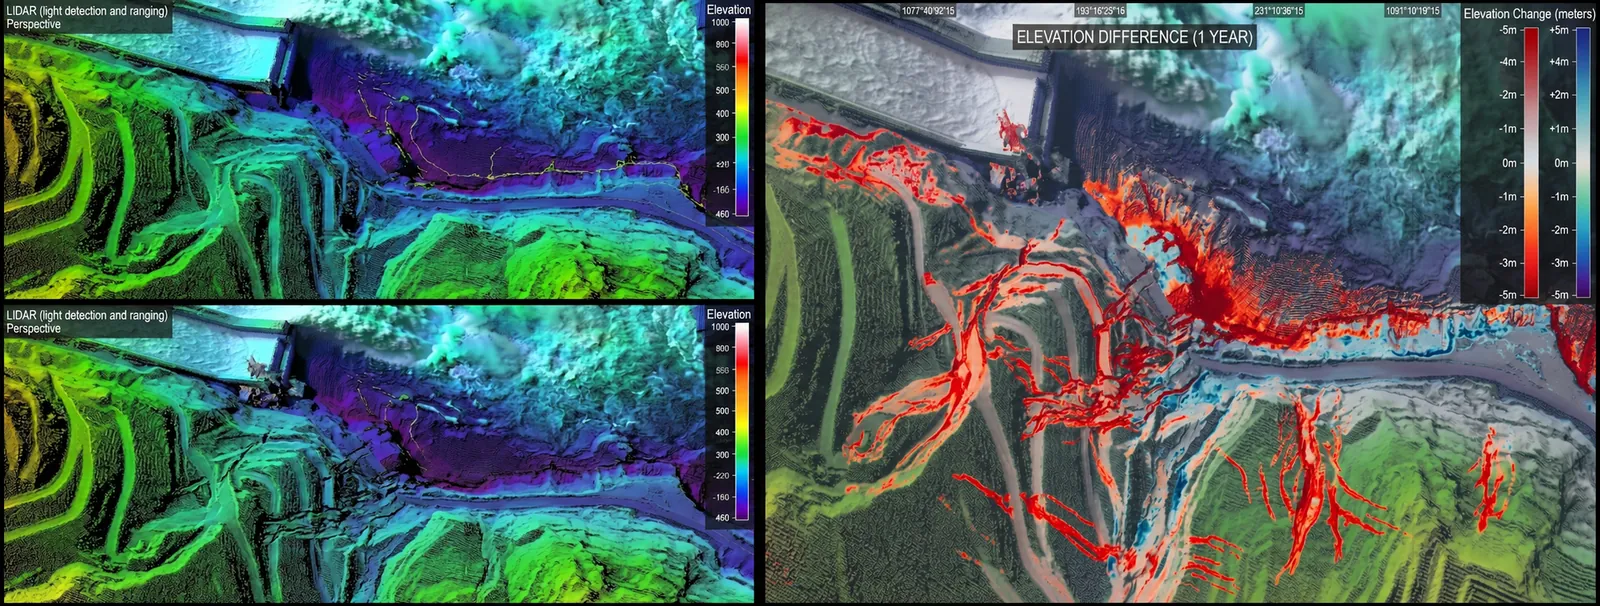
Surfaces, difference maps and erosion and accumulation volumes per zone and per run, with the run history in one place and exports in open formats for your own analysis.
AI
Point-cloud processing removes noise and returns from people or equipment over the model, and highlights where change between runs concentrates, so analysis starts with the areas that moved.
What we deliver
Built on the same measurement technology CRATUS uses for bulk material inventory.
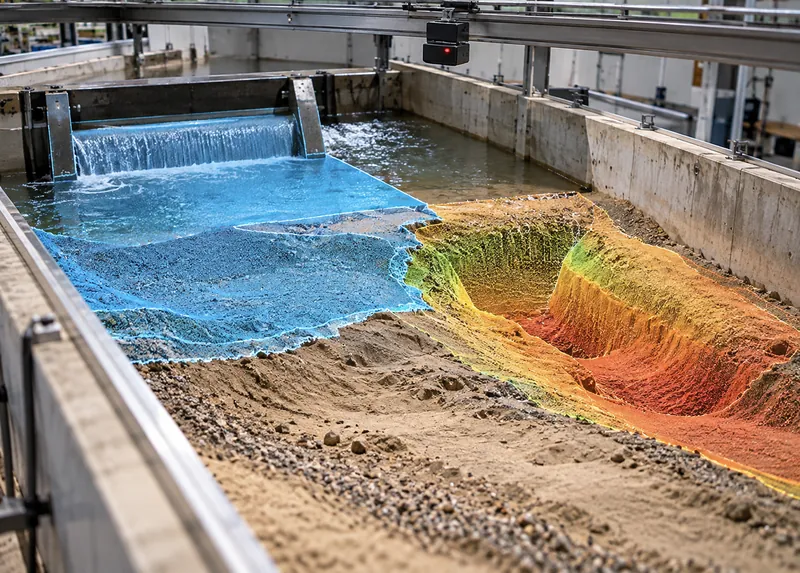
A baseline surface of the prepared bed and a new surface after each run or interval.
Sensing · Edge
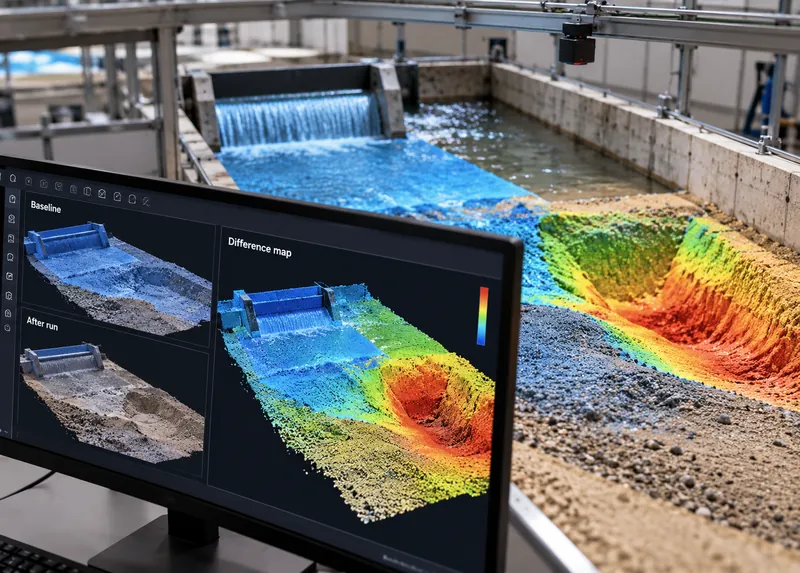
Surface-to-surface comparisons that show where the bed lowered and where it rose.
Software
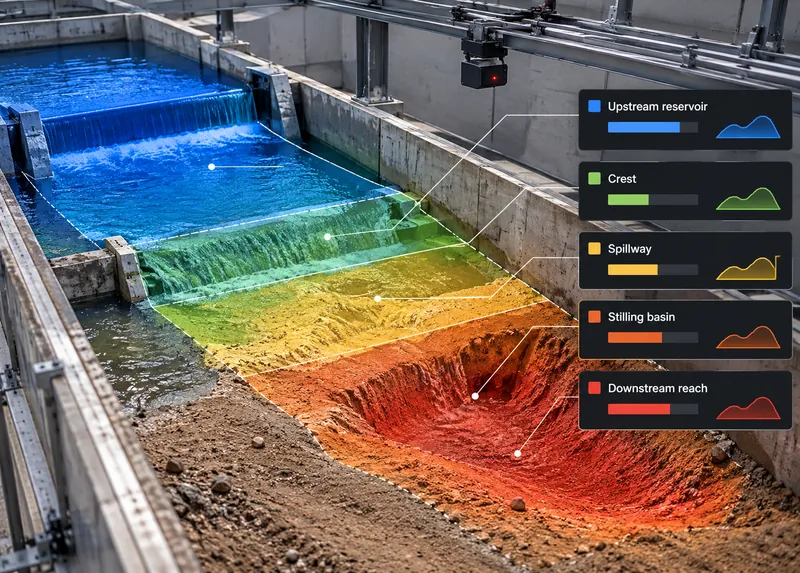
Eroded and accumulated volume for each zone you define: upstream reservoir, crest, spillway, stilling basin, downstream reach.
Software
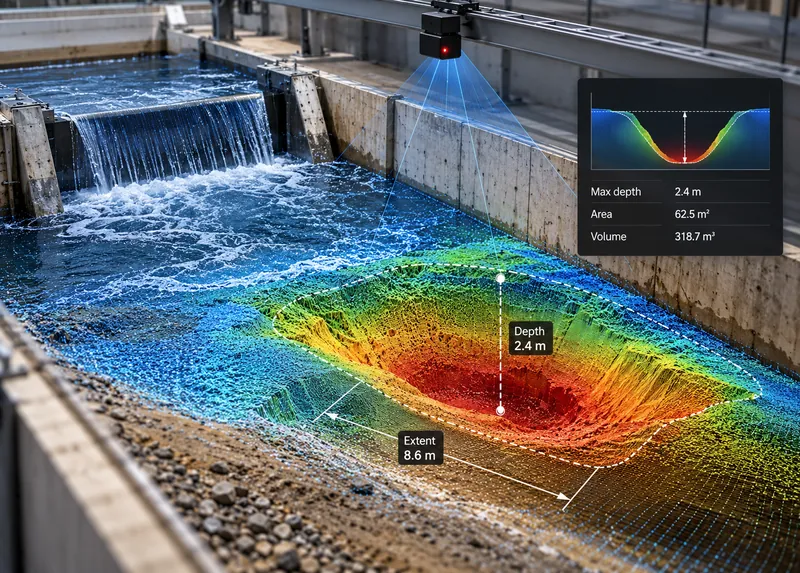
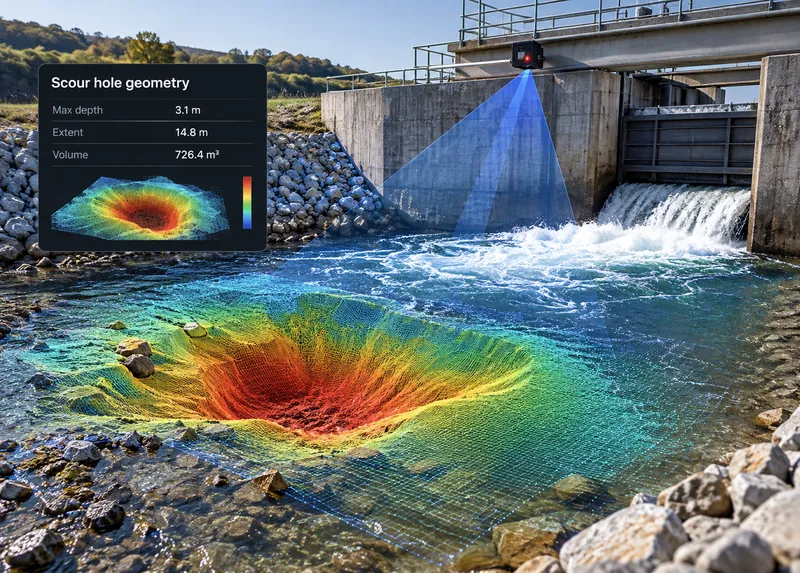
Depth, extent and volume of scour holes downstream of spillways and outlets.
Software
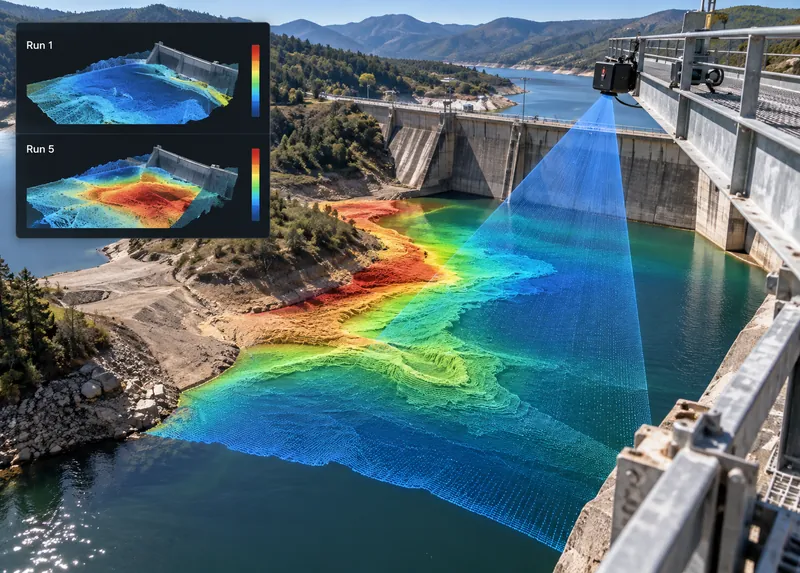
Deposition patterns upstream of the dam and in the reservoir area, run by run.
Software
Point clouds, surfaces and volume tables in open formats for your own analysis.
Software · AI
The CRATUS VMS system
The same sensors and edge computer used for bulk material inventory, configured for a laboratory model.
Overall surface coverage
Sees a large share of the material surface from one mounting point and follows the pile as it rises and falls, without re-aiming.
Targeted, longer reach
Looks into the places a wide view cannot reach well: reclaim craters, far corners, deep bins and the back of tall bays.
ASSET-Rx EDGE middleware
Runs at the site, combines the sensors into one surface and computes volume, so only results need to leave the building.
One system
CRATUS defines the sensor layout, supplies the sensors and edge computer, sets up zones on your model grid and delivers the data. One point of contact from model layout to the last run. Browse the VMS systems for bulk solids.
All CRATUS productsThese details let CRATUS build a coverage model for your structure.
How we work
Every structure is different, so every installation starts with a coverage model of your structure and material. Sensor types, counts and positions are decided before anything ships.
Structure type and size, material, how it is filled and reclaimed, power, connectivity and dust conditions.
CRATUS models your structure and material behavior to choose sensor types, counts and mounting positions before anything ships.
Brackets, power and network, with installation instructions and remote support for your contractor or ours.
Reference scans, zone set-up and bulk density per material, checked against a known quantity where one is available.
Dashboard, reports and alerts, a lens-care schedule and engineering support for the life of the system.
Standards & practices
Results are delivered in formats research teams already use.
Formats and deliverables are agreed per project. CRATUS provides measurement data and analysis; interpretation of model results remains with the research team.
By comparing surfaces. LiDAR scans the model bed before a run and again after it; the difference between the two surfaces shows where earth was removed and where it was deposited, and the software computes the volume of each.
Repeatability. Fixed sensors scan from the same positions every time, so surfaces line up without re-registration, and small differences reflect the bed rather than the scanner position.
Above water, yes. Exposed surfaces such as the embankment, crest and dry banks can be scanned at intervals during a run. Submerged areas are measured when the flow is stopped and the bed is drained, because LiDAR light does not see reliably through water.
Point clouds and surfaces for every scan, difference maps between scans, and erosion and accumulation volumes per zone, in open formats.
Yes. Zones are defined on your model grid, such as reservoir, embankment, spillway, stilling basin and downstream reach, and can be changed after the runs.
Yes, for the exposed surfaces. Embankment erosion during overtopping can be scanned at intervals, and the full surface measured once the flow stops.
Both. The sensors, edge computer and software are CRATUS VMS components; set-up for a laboratory model, zone definitions and data delivery are provided as an engineering service.
Yes. CRATUS works directly with plant teams, system integrators and IT departments, and provides installation instructions, network requirements and remote support during commissioning.
Send the model dimensions, the flume or basin layout, the materials used and what you need to measure. CRATUS will reply with a sensor layout and data plan.
Talk to a CRATUS engineer
Send us the model layout, materials and what you need to quantify. A CRATUS engineer will reply with a sensor layout and a data plan.
Keep exploring
Illustrations are not to scale. Specifications subject to change without notice.
GET IN TOUCH
One of our experts will be communicating with you shortly. We are committed to understanding your application and providing support, tailored to your specific requirements.