

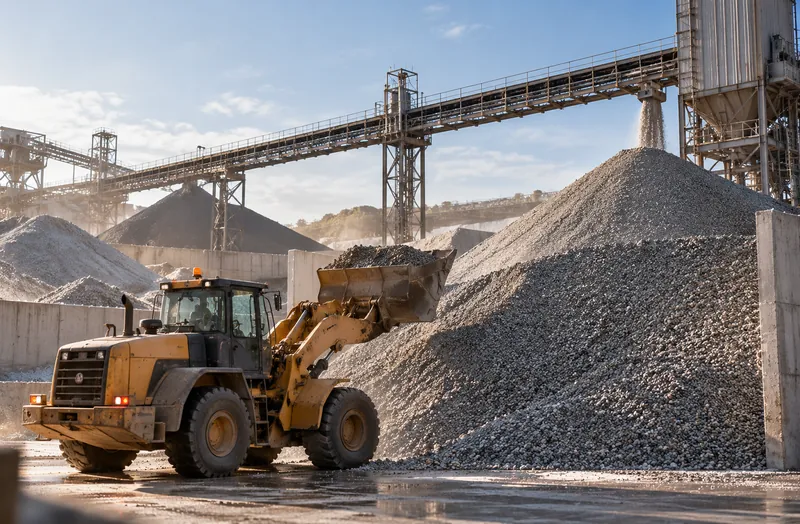
Production plans built on guesses
If the pile holds less than the books say, a line stops or a schedule slips. If it holds more, cash sits in material you didn’t need to buy.
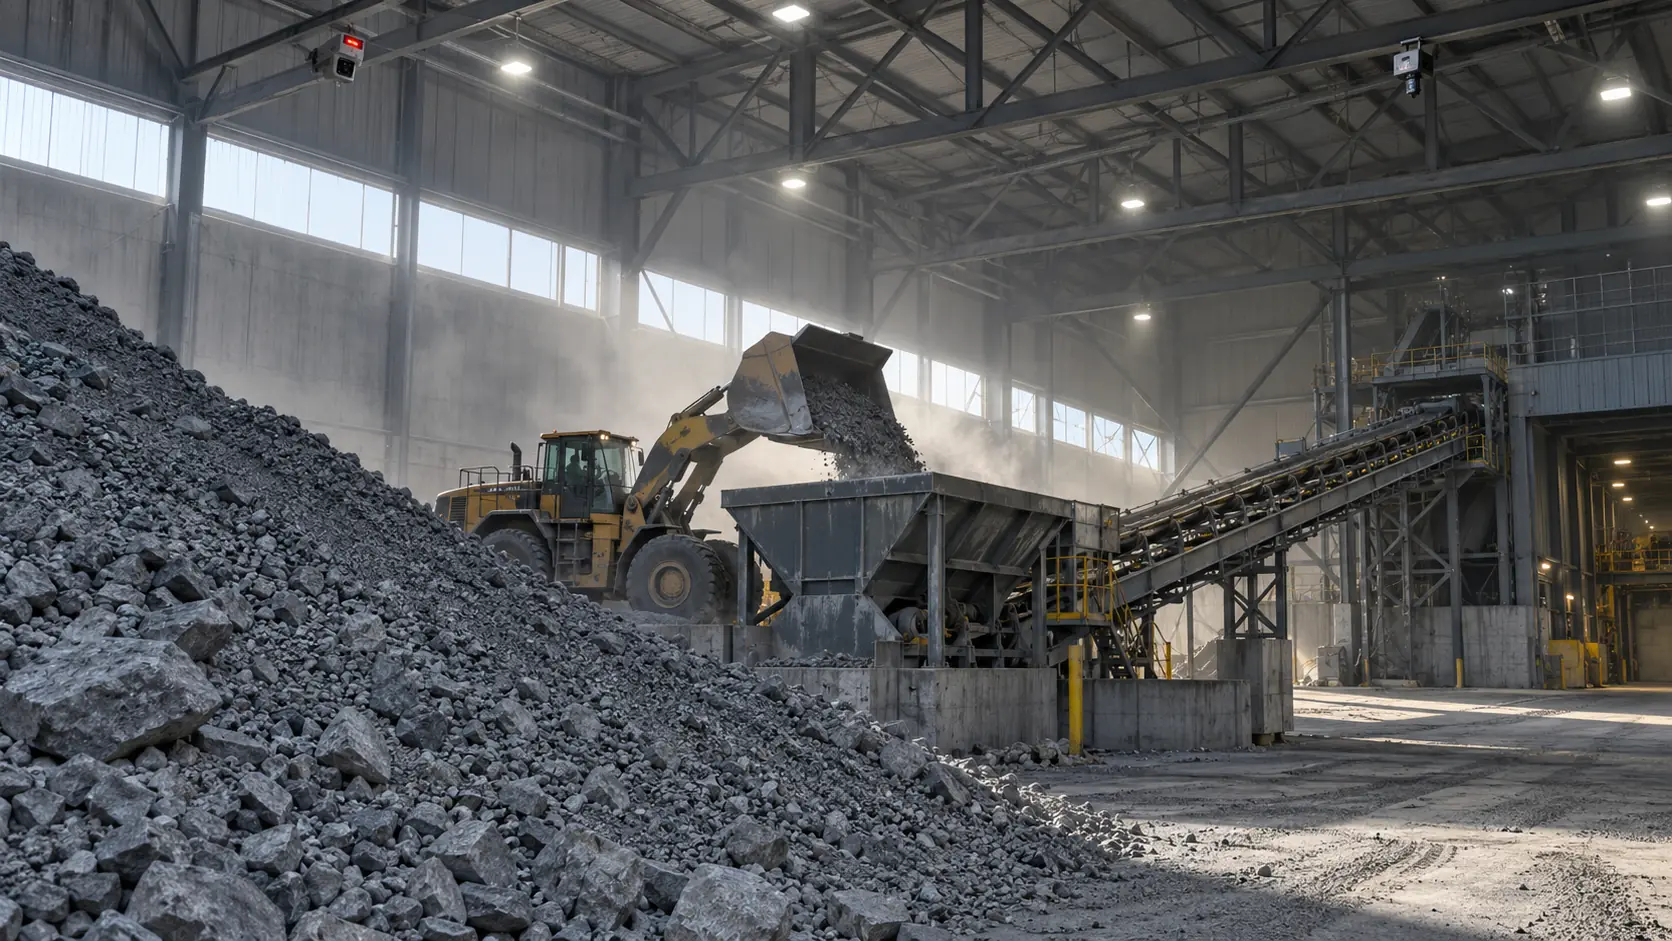
You can’t manage what you can’t measure
Production starts with knowing what you have.
CRATUS measures the volume and weight of bulk solid raw material in storage, continuously, with fixed LiDAR sensors and an edge computer at the site. Raw material is the start of the manufacturing process: if you can’t quantify what you have on hand, you can’t know how much you will produce, when to reorder, or what your inventory is worth.
The challenge
Most plants know their finished goods to the unit and their raw material to an estimate. The estimate drives everything downstream.
If the pile holds less than the books say, a line stops or a schedule slips. If it holds more, cash sits in material you didn’t need to buy.

Book inventory drifts from physical inventory. A walk-around estimate or a periodic survey then forces a write-off or an adjustment nobody can explain.
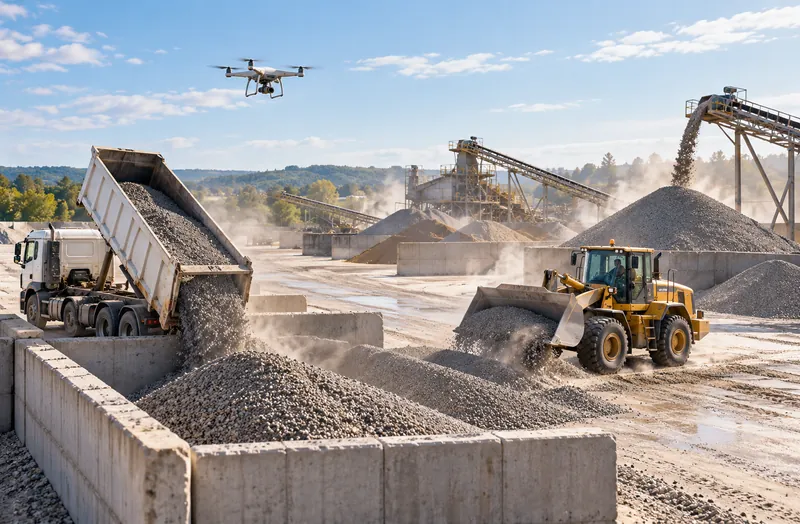
A manual count or a drone flight is a snapshot. Between counts, receiving, consumption, moisture and spills change the number every shift.
Measure raw material the way you measure finished goods: continuously, per location, in units finance trusts.
See the approachWhy it matters
Every downstream number depends on the first one: how much raw material is on hand.
Our approach
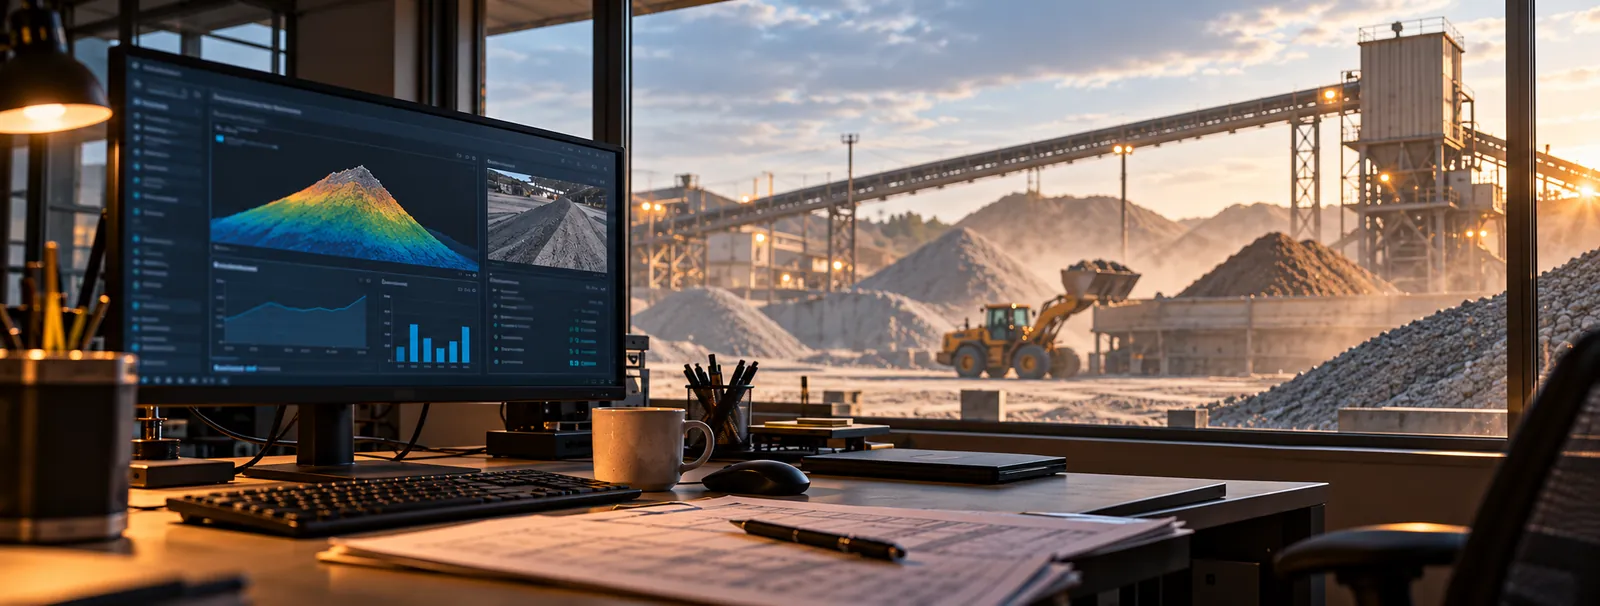
For inventory, the number that matters is the one purchasing and finance can trust: volume from the surface, weight from bulk density, history for every structure.
LiDAR sensing
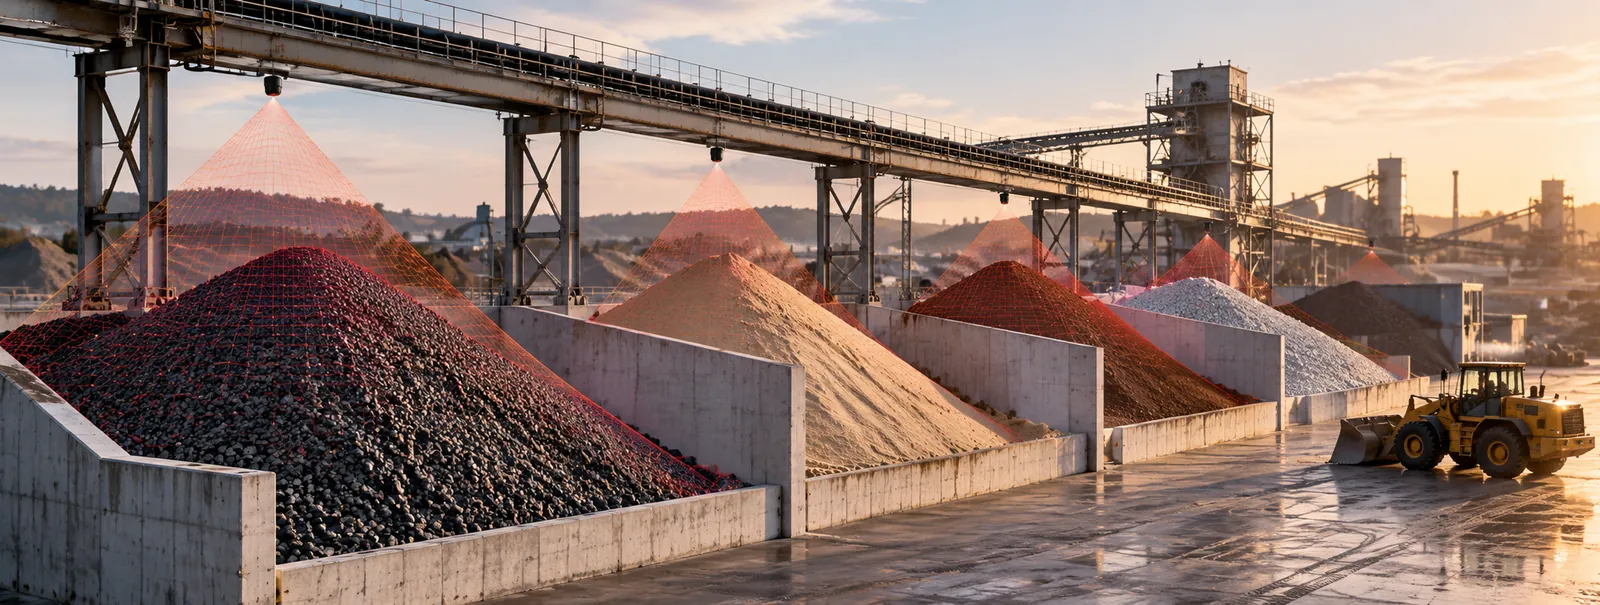
Fixed LiDAR sensors above each pile, bay, bunker, silo or dome measure the material surface as a dense 3D point cloud with their own laser light, so lighting never changes the count. Wide field-of-view units cover the overall surface; directional units look into corners, craters and far walls.
Edge computing
One edge computer per site merges every sensor into a single surface and calculates volume for each structure and zone. Only results, not raw video, leave the building, over Ethernet, Wi-Fi or cellular; sites without easy IT access can start on cellular.
Software & dashboards
Purchasing, operations and finance read the same numbers: volume, weight and history for every material and structure, with reports and exports for the systems you already run.
AI
AI separates the material surface from loaders, trucks, people and airborne dust so the count stays clean, and flags changes that do not match the plan, such as an unplanned draw-down.
What we deliver
From one pile to every storage structure across a company.
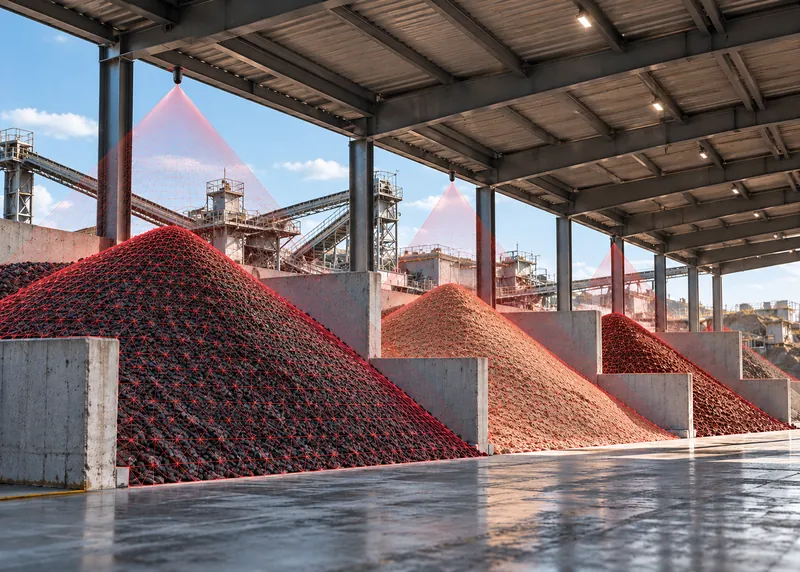
Scheduled scans of every structure, with history that shows receiving and consumption over time.
Sensing · Software
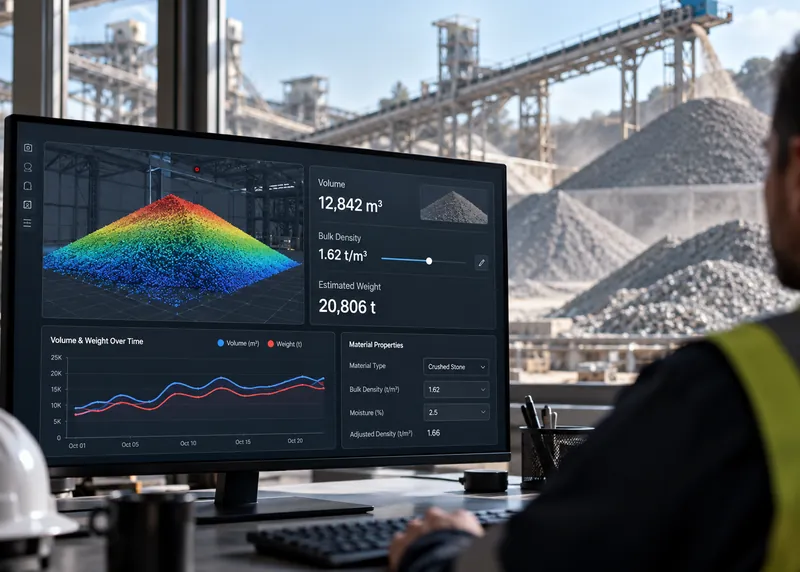
Weight from measured volume and the bulk density of each material, with density adjustable as material or moisture changes.
Software
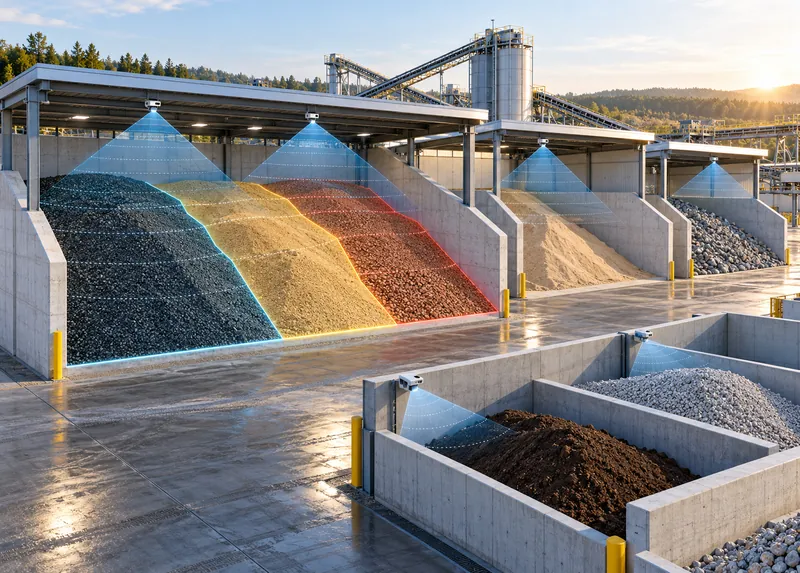
Each bay, bunker, silo or dome, and each zone inside it, reported separately, so mixed materials stay separate.
Edge · Software
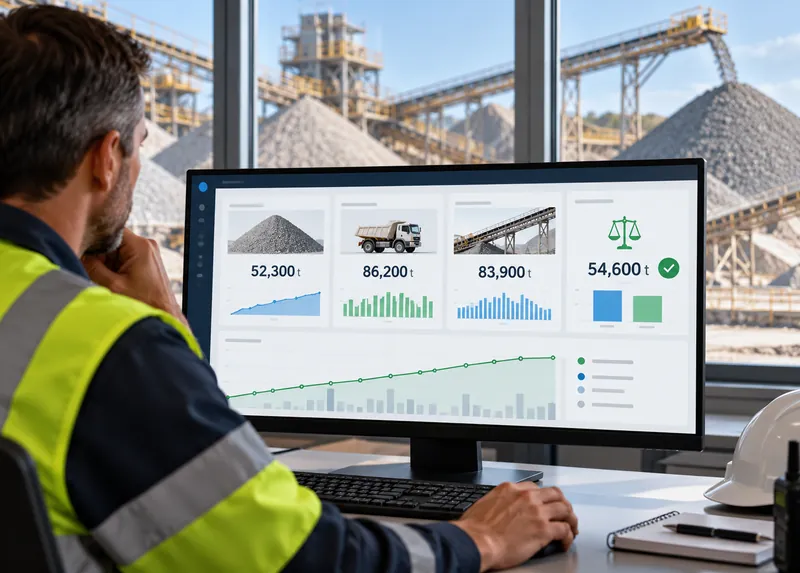
Measured inventory you can compare with receipts and consumption at month end, not after a quarterly survey.
Software
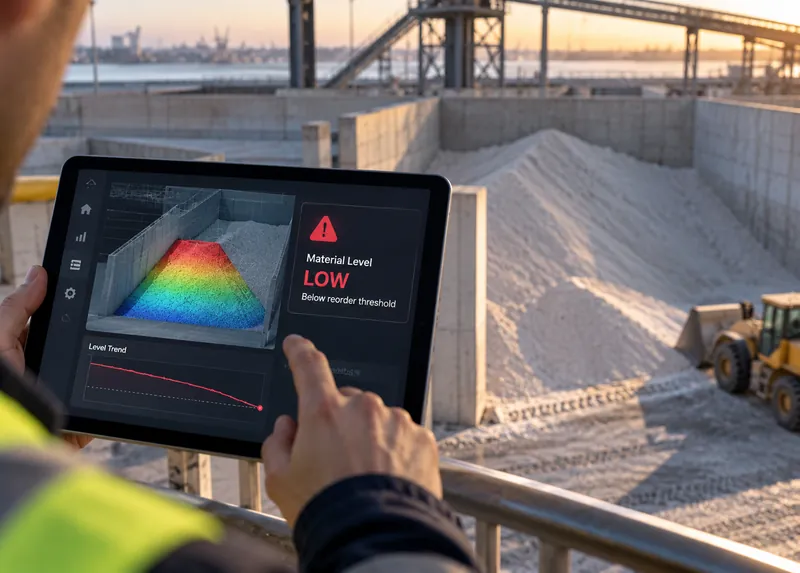
Thresholds per material and location, so purchasing hears about a low pile before production does.
Software · AI
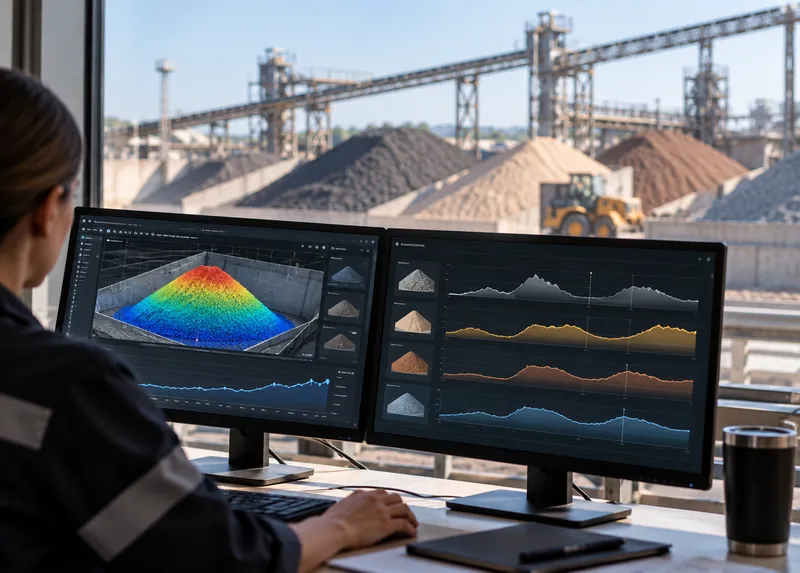
Consumption patterns per material to support purchasing and production planning.
AI
The CRATUS VMS system
The structures differ; the inventory output is the same: volume, weight and history per location.
Overall surface coverage
Covers most of a pile or bay from one mounting point and follows it as receiving and consumption change its shape.
Targeted, longer reach
Added where a wide view leaves gaps, such as reclaim craters, far corners, deep bins and the back of tall bays, so every structure reports a complete number.
ASSET-Rx EDGE middleware
Runs at the site and turns many sensors into one volume per zone, so only the numbers that feed inventory leave the building.
Cloud or local
Volume, weight and history per structure and zone for purchasing, operations and finance. Choose a cloud subscription or a local license per unit, per site or company-wide.
For trusses, walls and ceilings
Holds each sensor at the angle chosen in the coverage model, on the truss, wall or ceiling you already have.
For extremely dusty sites
For heavy dust where compressed air is available: keeps the sensor window clear between scheduled cleanings.
One system
CRATUS designs the coverage, supplies the sensors and edge computer, runs the software and supports the system after commissioning. One point of contact from site survey to the daily inventory number. Browse the VMS systems for bulk solids.
All CRATUS productsThese details let CRATUS build a coverage model for your structure.
How we work
Every site is different, so we start with a coverage model of your structures and materials. Sensor types, counts and positions are set before anything ships.
Which piles, bays or bins hold which materials, how they are filled and reclaimed, plus power, connectivity and dust conditions.
CRATUS models each structure and material to choose sensor types, counts and mounting positions before anything ships.
Brackets, power and network, with instructions and remote support for your contractor or ours.
Reference scans, zones and bulk density per material, checked against a delivery weighed on a truck scale where one is available.
Dashboard, reports and alerts for each structure, a lens-care schedule and engineering support for the life of the system.
Standards & practices
Raw material storage often involves combustible dust, and the rules depend on the site. Area classification comes first; the installation is planned around it.
Area classification and compliance decisions rest with the site owner and the authority having jurisdiction. CRATUS plans the installation around these requirements and documents it to support your review; we don’t self-certify.
Because every production plan starts from it. Raw material on hand sets how much you can produce and when you need to reorder, and it is a balance-sheet number. An inaccurate count shows up as stoppages, excess purchasing or write-offs.
With fixed LiDAR sensors above the material and an edge computer at the site. The sensors measure the surface, the edge computer calculates volume per structure and zone, and the dashboard reports volume and weight with history.
As often as you need. Measurement runs on a schedule that suits the operation, from many times per day to daily snapshots for reporting.
Weight is measured volume multiplied by the bulk density of the material. Density is set per material at commissioning and can be checked against a known quantity, such as a delivery weighed on a truck scale.
The density value can be updated per material when it changes. Comparing measured volume with weighed receipts over time shows when the density assumption needs adjusting.
In most cases it reduces how often you need them. Continuous measurement gives a current number between surveys; many sites keep a periodic check as an audit reference.
One 120 VAC supply near the edge computer, 12 VDC for the sensors and a network connection. Where 12 VDC, an enclosure or internet access are missing, CRATUS can supply the power supply, enclosure and a cellular modem.
Dust on the sensor window is handled by scheduled cleaning, and AI filtering keeps airborne dust out of the measurement. For extremely dusty sites with compressed air, an air purge collar keeps the window clear between cleanings.
Yes, with the right planning. Area classification comes first, then the installation is planned around it, including where equipment is placed and when it is energized. CRATUS documents the installation for the site owner and the authority having jurisdiction.
The structures and their sizes, the material in each and how they are filled and reclaimed. CRATUS replies with a proposal that shows the sensor layout and expected performance, followed by a quote with options.
Anyone you give dashboard access. Choose a cloud dashboard subscription, or a local dashboard license per unit, a site license for several units or a company license.
Yes. The dashboard supports reports and data exports for the systems you already run, and CRATUS works with plant teams, system integrators and IT departments, with installation instructions, network requirements and remote support.
Talk to a CRATUS engineer
Tell us what you store and where. A CRATUS engineer will reply with a coverage approach and what continuous inventory would look like at your site.
Keep exploring
Illustrations are not to scale. Specifications subject to change without notice.
GET IN TOUCH
One of our experts will be communicating with you shortly. We are committed to understanding your application and providing support, tailored to your specific requirements.